Physical Address
23,24,25 & 26, 2nd Floor, Software Technology Park India, Opp: Garware Stadium,MIDC, Chikalthana, Aurangabad, Maharashtra – 431001 India
Physical Address
23,24,25 & 26, 2nd Floor, Software Technology Park India, Opp: Garware Stadium,MIDC, Chikalthana, Aurangabad, Maharashtra – 431001 India

A post by Australian climate commentator Peter Clack makes several claims about Earth’s ice cover, atmospheric carbon dioxide, ocean heat and long-term temperature changes. It argues that the amount of ice covering Earth’s land has remained stable for more than a century and that current warming may be driven mainly by natural factors such as the oceans, solar radiation and orbital cycles. The post also compares today’s temperatures with those reconstructed for the Phanerozoic, a geological period spanning hundreds of millions of years, and suggests that Earth could be heading towards another glacial period. However, satellite observations, atmospheric measurements and climate assessments from NASA, NOAA, the IPCC and the World Meteorological Organisation show that these claims leave out key evidence about current ice loss, greenhouse gases and the drivers of recent warming.
Claim Post:
Claim 1: “The percentage of ice cover on Earth’s land surface has remained remarkably stable for more than a century. Despite forty years of climate alarmism and the expenditure of trillions of dollars, ice still covers approximately 10% of Earth’s land area today, in 2026. In 1900, at the tailend of the Little Ice Age (1300–1850), ice was estimated at 10-11%. It does not appear to be in rapid retreat.”
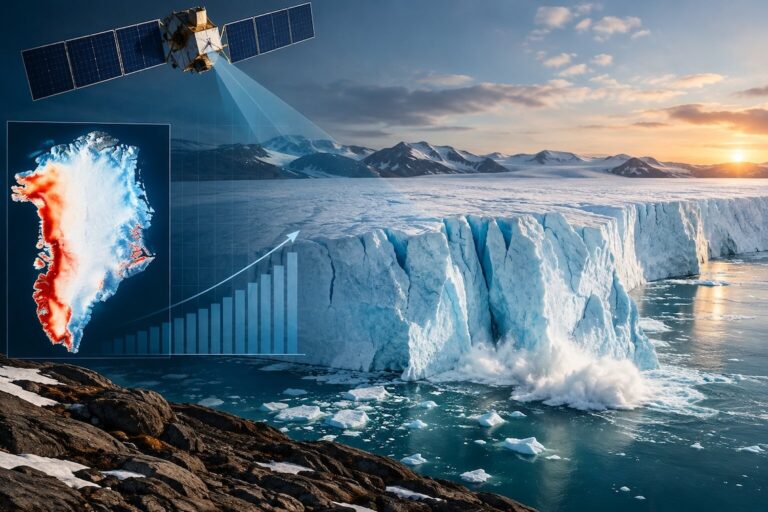
Fact: Misleading. Around 10% of Earth’s land is currently covered by glaciers, ice caps and ice sheets, but this figure describes the area covered by ice, not whether the amount of ice is increasing or decreasing. NASA’s GRACE and GRACE Follow-On satellite observations show that between 2002 and 2025, Greenland lost about 264 billion tonnes of ice per year, while Antarctica lost about 135 billion tonnes per year.
The claim also places the Little Ice Age glacier maximum around 1900, whereas records from the U.S. Geological Survey show that glaciers in Glacier National Park reached their maximum size around 1850. Between the Little Ice Age maximum and 2005, the number of glaciers larger than 0.1 square kilometres in the park fell from about 80 to 32.
Claim 2: “Human activities contribute roughly 3% to the annual carbon flux. We are discussing the trace gas – CO2 – that still represents only 426 ppm of the atmosphere. Furthermore, water vapour provides roughly 10 times the warming capacity of all atmospheric CO2 combined. To understand the climate, one must look to the oceans: the atmosphere contains only about 1-2% of the surface carbon, while the oceans hold 86%.”
Fact: Misleading. Comparing human emissions with the much larger natural carbon exchanges does not account for the fact that natural sinks remove only part of the CO2 released by human activities. NOAA’s CarbonTracker estimates that land and ocean sinks absorbed about 47% of fossil-fuel CO2 emissions between 2001 and 2024, leaving the remainder to raise atmospheric concentrations. NOAA measurements show global atmospheric CO2 at 429.12 ppm in July 2026, far above the roughly 280 ppm level before industrialisation.
Water vapour is a powerful greenhouse gas, but its atmospheric concentration is primarily controlled by temperature, making it a positive climate feedback rather than an independent long-term forcing. The IPCC finds that warming increases atmospheric water vapour, which in turn reduces outgoing radiation and amplifies the initial warming. Long-lived greenhouse gases such as CO2 provide the radiative forcing that drives the initial temperature change.
Claim 3: “This massive thermal power of the oceans is the planet’s climate regulator, a far more powerful force than atmospheric fluctuations. Orbital mechanics & solar radiance, the primary engines of temperature change.”
Fact: False. The oceans are the largest reservoir of heat in the climate system and absorb most of the excess energy, but observations show that ocean heat content is increasing rather than offsetting global warming. NOAA reports that the oceans have absorbed more than 90% of the excess heat trapped in Earth’s climate system, while global ocean heat content has continued to rise.
Solar activity and orbital variations do affect Earth’s climate, especially over long periods, but they cannot account for the warming observed since the industrial era. The IPCC estimates that natural drivers changed global surface temperature by only −0.1°C to +0.1°C between 1850–1900 and 2010–2019, compared with 0.8°C to 1.3°C of human-caused warming, with a best estimate of 1.07°C.
Claim 4: “Current global temperatures remain several degrees cooler than the longer-term Phanerozoic average of 18-25°C. But no-one can say with certainty whether the Earth is still warming, or about enter another 100,000 year glacial period.”
Fact: False. Earth’s temperature has varied widely over geological time, but the claim of a long-term Phanerozoic average of 18-25°C does not accurately represent the latest reconstruction. A study reconstructed global mean surface temperature over the past 485 million years and found a range from about 11°C to 36°C. The study also found a strong relationship between atmospheric CO2 and global temperature and identified CO2 as the dominant control on variations in Phanerozoic climate.
There is also no scientific uncertainty about whether Earth is still warming over the long term. The WMO’s State of the Global Climate 2025 report confirms that 2015-2025 were the 11 warmest years on record, with 2025 about 1.43°C above the 1850-1900 average. Orbital cycles can influence the timing of future glacial periods, but the IPCC finds that they do not explain the warming observed since the industrial era.
References:
https://svs.gsfc.nasa.gov/31156
https://svs.gsfc.nasa.gov/31158
https://www.usgs.gov/centers/norock/science/status-glaciers-glacier-national-park
https://www.gml.noaa.gov/ccgg/carbontracker/CT2026/index.php
https://gml.noaa.gov/ccgg/trends
https://www.ipcc.ch/report/ar6/wg1/chapter/chapter-7
https://www.climate.gov/news-features/understanding-climate/climate-change-ocean-heat-content
https://www.sciencedirect.com/science/article/pii/S1342937X25001273
https://pubmed.ncbi.nlm.nih.gov/39298603
https://wmo.int/publication-series/state-of-global-climate/state-of-global-climate-2025
Banner image: Photo by Francesco Ungaro on Unsplash
Sections of this article may have been developed with the assistance of artificial intelligence tools to support research, drafting and language refinement. All information has been reviewed, edited and verified by the author/editor to ensure accuracy, context and editorial integrity. The responsibility for the final content, interpretations and conclusions rests solely with the publisher.