Physical Address
23,24,25 & 26, 2nd Floor, Software Technology Park India, Opp: Garware Stadium,MIDC, Chikalthana, Aurangabad, Maharashtra – 431001 India
Physical Address
23,24,25 & 26, 2nd Floor, Software Technology Park India, Opp: Garware Stadium,MIDC, Chikalthana, Aurangabad, Maharashtra – 431001 India

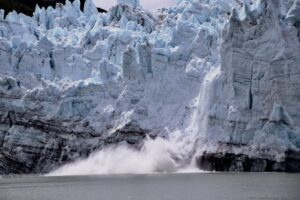
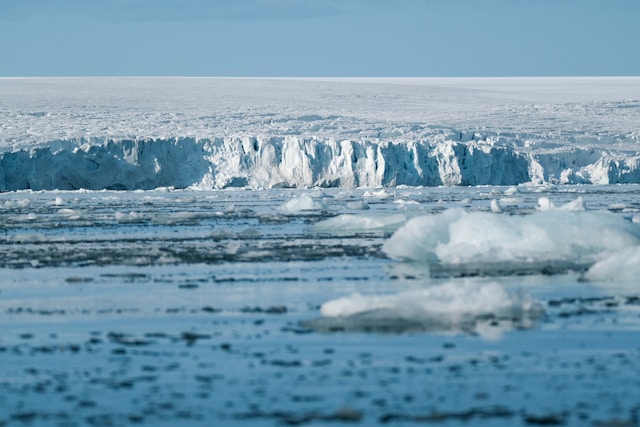
A viral post has dismissed sea level rise as one of the biggest climate “scare stories”, arguing that current changes are far smaller than the natural rise that followed the last ice age. Citing climatologist Dr John Christy, the post claims that sea levels once rose about 12.5 cm per decade for 8,000 years but are now rising by only 2.5 cm per decade. It further claims that there has been no acceleration in sea level rise over the past 145 years. However, long-term tide gauge records, satellite measurements and peer-reviewed research tell a different story. While sea levels did rise rapidly as the planet emerged from the last ice age, using that period to dismiss the present trend leaves out crucial context. Modern observations show that global sea level rise has accelerated, with the rate more than doubling during the satellite era.
Claim post:
Claim 1: “One of the biggest climate scare stories is sea level rise, sold as proof of a looming catastrophe. But the data do not support this.”
Fact: False. Observational data clearly show that global mean sea level is rising, and that the rate has increased over time. According to the IPCC, global mean sea level rose by about 20 cm between 1901 and 2018. More importantly, the average rate increased from about 1.3 mm per year during 1901 to 1971, to 1.9 mm per year during 1971 to 2006, and then to 3.7 mm per year during 2006 to 2018. The IPCC assesses with high confidence that the rate of sea level rise has accelerated since the 1960s.
More recent satellite observations show that this trend has continued. The World Meteorological Organisation reported that the rate of global mean sea level rise increased from 2.1 mm per year during 1993 to 2002 to 4.7 mm per year during 2015 to 2024. In 2024, global mean sea level reached its highest level since satellite measurements began in 1993. These measurements directly contradict the suggestion that observational data do not support concern about rising sea levels.
Claim 2: “As per climatologist Dr John Christy, ‘sea levels rose about 12.5 cm per decade for 8,000 years. Then it levelled off and now it’s rising only about 2.5 cm per decade.’ That’s five times slower than the natural rise after the last ice age.”
Fact: Misleading. Sea levels did rise much faster during the period following the last ice age, but presenting this as a steady rate for 8,000 years leaves out how dramatically conditions changed during that time. A study published in the Proceedings of the National Academy of Sciences (PNAS) reconstructed global sea level and ice volume over the past 35,000 years. It found that the main phase of deglaciation, from about 16,500 to 8,200 years ago, saw an average rise of around 12 metres per thousand years, or roughly 12 cm per decade. But this rise was far from constant. During one particularly rapid period around 14,500 to 14,000 years ago, rates reached at least 40 mm per year, while other periods saw much slower changes. After about 8,200 years ago, the rate progressively declined as the great ice sheets left by the last glacial period disappeared.
That makes a direct comparison with today’s sea level rise misleading. The rapid post-glacial rise occurred while enormous ice sheets that had covered large parts of North America and northern Europe were retreating. Modern sea level rise is occurring after several thousand years of comparatively stable global ocean volume. The same study found that ocean volume remained nearly constant from around 2,500 years ago until renewed sea level rise began roughly 100 to 150 years ago. The claim that the present rate is only 2.5 cm per decade is also inconsistent with recent observations. The IPCC estimated 3.7 cm per decade for 2006 to 2018, while WMO data put the average for 2015 to 2024 at 4.7 cm per decade.
Claim 3: “And in the most recent records, there’s been no acceleration in the past 145 years. There is no crisis. No acceleration. And no reason for the hysteria.”
Fact: False. The claim that there has been no acceleration is contradicted by both long-term reconstructions and modern satellite measurements. A study published in Nature Climate Change reconstructed global mean sea level from 1900 to 2015 using tide gauge records and found a persistent acceleration since the 1960s. The IPCC reached the same conclusion after assessing multiple observational records, finding a robust acceleration over the twentieth century. For the satellite period from 1993 to 2018, it estimated an acceleration of about 0.094 mm per year squared.
Satellite measurements provide an independent and increasingly precise record of the same change. NASA reports that the trajectory of global mean sea level rise has more than doubled over the three decades since satellite observations began. Although the amount of rise can vary from one year to another because of natural climate patterns such as El Niño and La Niña, those short-term fluctuations do not erase the longer trend. NASA’s latest analysis shows that sea level rose relatively little in 2025 because La Niña shifted more water onto land, but the long-term satellite record still shows an increasingly upward trend.
What Is Driving the Acceleration in Global Sea Level Rise?
Global sea level changes mainly for two physical reasons. As the ocean absorbs heat, seawater expands and takes up more space. At the same time, melting glaciers and ice sheets transfer water that was stored on land into the ocean. The IPCC estimates that ocean thermal expansion accounted for about 38% of global mean sea level rise between 1901 and 2018, while glacier mass loss contributed about 41%. The contribution from the Greenland and Antarctic ice sheets has also grown, becoming four times larger during 2010 to 2019 than it was during 1992 to 1999.
Research has also connected these physical processes directly with the observed acceleration. A study led by NASA’s Jet Propulsion Laboratory in Southern California reconstructed the causes of sea level change since 1900 and found that the observed rise could be explained by thermal expansion, loss of ice from glaciers and ice sheets, and water changes stored on land. The researchers found that the acceleration since the 1970s was driven by a combination of ocean thermal expansion and increasing ice loss from Greenland. This is why the scientific concern is not based simply on the fact that sea level is rising. It is based on measurements showing that the rate itself has increased as the oceans have warmed and land ice has continued to lose mass.
References:
https://www.un.org/sites/un2.un.org/files/slr_technical_brief_26_aug_2024.pdf
Sea Level Is Rising and Will Continue to Do So: WMO Report
https://wmo.int/news/media-centre/wmo-report-documents-spiralling-weather-and-climate-impacts
https://www.pnas.org/doi/10.1073/pnas.1411762111
https://www.nature.com/articles/s41558-019-0531-8
https://www.ipcc.ch/report/ar6/wg1/downloads/report/IPCC_AR6_WGI_Chapter09.pdf
https://www.ipcc.ch/report/ar6/wg1/chapter/chapter-9
https://www.jpl.nasa.gov/news/nasa-led-study-reveals-the-causes-of-sea-level-rise-since-1900
Banner image: Photo by Magdalena Kula Manchee on Unsplash
Sections of this article may have been developed with the assistance of artificial intelligence tools to support research, drafting and language refinement. All information has been reviewed, edited and verified by the author/editor to ensure accuracy, context and editorial integrity. The responsibility for the final content, interpretations and conclusions rests solely with the publisher.