Physical Address
23,24,25 & 26, 2nd Floor, Software Technology Park India, Opp: Garware Stadium,MIDC, Chikalthana, Aurangabad, Maharashtra – 431001 India
Physical Address
23,24,25 & 26, 2nd Floor, Software Technology Park India, Opp: Garware Stadium,MIDC, Chikalthana, Aurangabad, Maharashtra – 431001 India

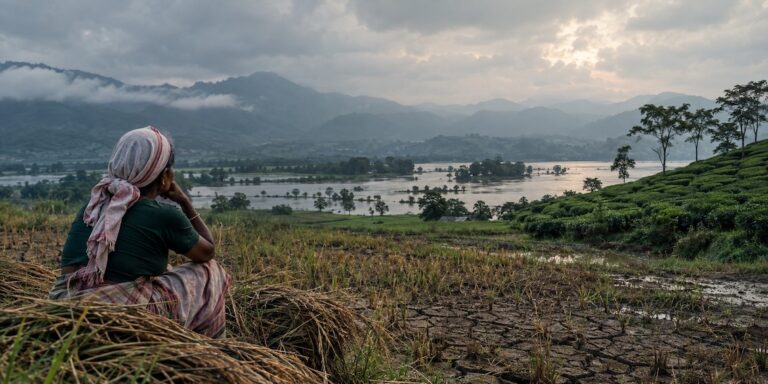
Assam has lost more people to this monsoon than any other state, and it has done so while officially short of rain. More than a hundred deaths have been recorded in the state since July, about 50 of them in Sivasagar district alone. Over the same period the east and northeast recorded a rainfall shortfall of about 30 per cent. Both figures are accurate. Read together, they describe a season that India’s standard measure of monsoon performance was never designed to capture.
That measure is the departure from the Long Period Average, the benchmark against which the India Meteorological Department reports seasonal rainfall. It is a useful number. It is also a seasonal aggregate, and an aggregate has no memory of when the rain fell, how fast it fell, or where it landed.
What the average was built to measure
The LPA was designed as a planning figure for a rain-fed farming economy, a way of answering one question: did the country receive roughly the water it expects across four months? For most of the twentieth century that question was a reasonable proxy for a second, more important one: did the water arrive in a form that farms, aquifers and reservoirs could use?
That proxy is weakening. The seasonal total is agnostic between a monsoon that delivers its normal across sixty well-spaced rain days and one that delivers the same volume in six violent bursts separated by eleven dry weeks. To the LPA these are the same season. To a district they are not remotely the same season.
A number that cancels itself out
Monsoon 2026 has made the point unusually clearly. June was among the driest on record, running roughly 40 per cent below normal and ranking as one of the driest Junes in more than a century. July then closed 1 per cent above its own normal, leaving the June and July cumulative figure at 13 per cent below normal.
The recovery, however, was almost entirely regional. Central India swung from a 50 per cent deficit in June to a 33 per cent excess in July. Northwest India moved from a 32 per cent shortfall to 4 per cent. East and northeast India and the southern peninsula barely moved at all. By 27 July the national figure stood at 16 per cent below normal, assembled out of a 30 per cent deficit in the east and northeast, 29 per cent in the southern peninsula, 4 per cent surplus in central India and 10 per cent shortfall in the northwest.
By 2 August the national shortfall had narrowed to about 12 per cent, Skymet recorded, and to roughly 11 per cent by 5 August in IMD’s extended range assessment. The improving headline concealed the distribution beneath it. In a reply to Parliament, the government confirmed that around 47 per cent of districts were in the deficient or large-deficient categories, and that sixteen meteorological subdivisions were running between 20 and 38 per cent below normal.
A national average built from opposite extremes is not a description of the season. It is the arithmetic residue of two disasters cancelling each other out on a spreadsheet.
The axis the average leaves out
The variable that actually carries the climate signal is intensity, and the seasonal total is blind to it. July alone produced 269 extreme heavy rainfall events and 918 very heavy rainfall events. IMD director general Mrutyunjay Mohapatra noted that the extreme count ran well above previous years, while adding an important caveat: part of the increase may reflect the larger number of rain gauges the department is monitoring in 2026.
That caveat deserves to travel with the statistic rather than being stripped from it. A denser observation network will detect more extremes even if the underlying atmosphere has not changed, and the honest version of the claim is that the observed rise is real but partly a measurement artefact of unknown size. It does not weaken the argument. It simply means the case rests on physics and on the pattern of damage rather than on a single year’s event count.
Rain that arrives but does not stay
Burst rainfall behaves differently from distributed rainfall once it reaches the ground. Aquifer recharge depends on water percolating slowly over weeks; when rain arrives in concentrated storm-like spells, more of it pools on the surface and evaporates or runs off before it reaches the soil. The same volume of water does much less work.
The consequences show up in the figures that matter more than the deficit. By the start of August, with the headline shortfall narrowing, kharif planting was still trailing the previous year by 3.88 million hectares and live storage across 166 major reservoirs stood at 44.39 per cent of capacity. Rainfall recovery and agricultural recovery are not the same event, and the gap between them is precisely what a seasonal percentage hides.
When the number decides who gets help
This is not only a problem of description. Seasonal and district-level rainfall aggregates feed into drought assessment, relief allocation and crop insurance triggers. A district can therefore sit in the deficient column on paper while its low-lying blocks are under water, and a state can be flood-hit and rainfall-short in the same fortnight, as Assam has been this season and as Gujarat was at the end of July.
Experts have made a related point about El Niño years more broadly: the occurrence of a poor monsoon cannot be prevented, but its impacts can be reduced through preparedness and adaptation. Preparedness has to be targeted, and targeting depends on measuring the right thing. If the trigger is an aggregate and the harm is a distribution, the aid will keep arriving in the wrong places.
The gap is where the false claims grow
Every monsoon of this shape produces two mirrored claims, and both rely on the same misreading. The first points at floods and concludes there is no drought. The second points at a near-normal national total and concludes that warnings about climate change were exaggerated. Neither survives contact with the district-level data, but both are intuitive precisely because the national figure is the only number most readers ever see.
A third variant blames El Niño alone. The pattern is used to argue that extreme weather is entirely natural and that greenhouse gases play no part, when in reality an El Niño today operates on top of an already warmed atmosphere. India is unusually exposed to all of this: a Reuters Institute survey found the country reporting the highest rate of encountering false or misleading climate news among the nations sampled.
What a better number would look like
None of this argues for abandoning the LPA. It argues for refusing to let it stand alone. A handful of metrics already exist in the data IMD publishes and would change what readers understand: the number of dry days in a season, the length of the longest consecutive dry spell, the share of seasonal rainfall delivered in the wettest five days, and district-level rather than subdivision-level distribution. Reported alongside the deficit, they would have made this season legible in June rather than in retrospect.
The season is also not over. The World Meteorological Organization has flagged a strengthening El Niño combining with a positive Indian Ocean Dipole between August and October, with mixed and uneven implications for Indian rainfall. Whatever the final national figure turns out to be, it will be a poor guide to what happened in any particular district, and the withdrawal-season coverage that treats it as a verdict will be measuring the wrong thing again.
India’s monsoon is not primarily failing to arrive. It is arriving differently. The instrument still being used to grade it was calibrated for a monsoon that arrived the old way.
References
https://mausam.imd.gov.in/responsive/monsooninformation.php
https://mausam.imd.gov.in/responsive/rainfall_statistics.php
https://www.fas.usda.gov/data/gain/2026/08/india-monsoon-recovery-fails-boost-sluggish-crop-planting
A strong El Niño demands planning, not panic [Commentary]
https://science.feedback.org/el-nino-misinformation
https://www.statista.com/statistics/1617268/climate-change-news-and-misinformation-worldwide
Banner Image: Photo by Thanuj Mathew on Unsplash
Sections of this article may have been developed with the assistance of artificial intelligence tools to support research, drafting and language refinement. All information has been reviewed, edited and verified by the author/editor to ensure accuracy, context and editorial integrity. The responsibility for the final content, interpretations and conclusions rests solely with the publisher.