Physical Address
23,24,25 & 26, 2nd Floor, Software Technology Park India, Opp: Garware Stadium,MIDC, Chikalthana, Aurangabad, Maharashtra – 431001 India
Physical Address
23,24,25 & 26, 2nd Floor, Software Technology Park India, Opp: Garware Stadium,MIDC, Chikalthana, Aurangabad, Maharashtra – 431001 India
CLAIM
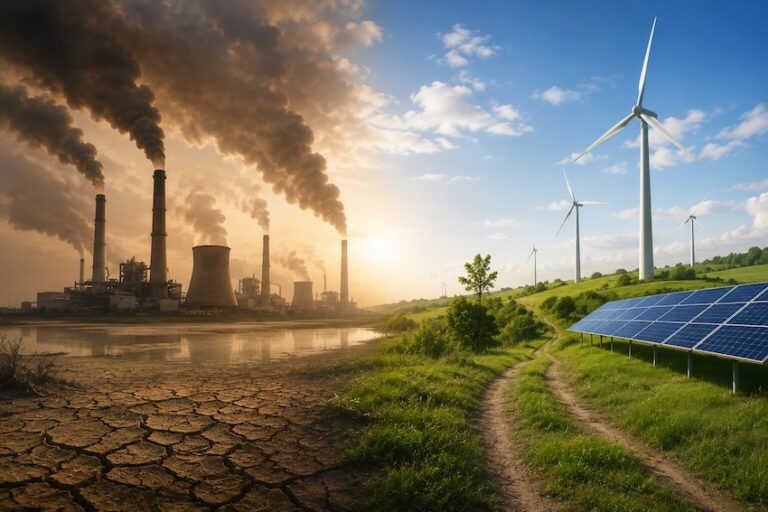
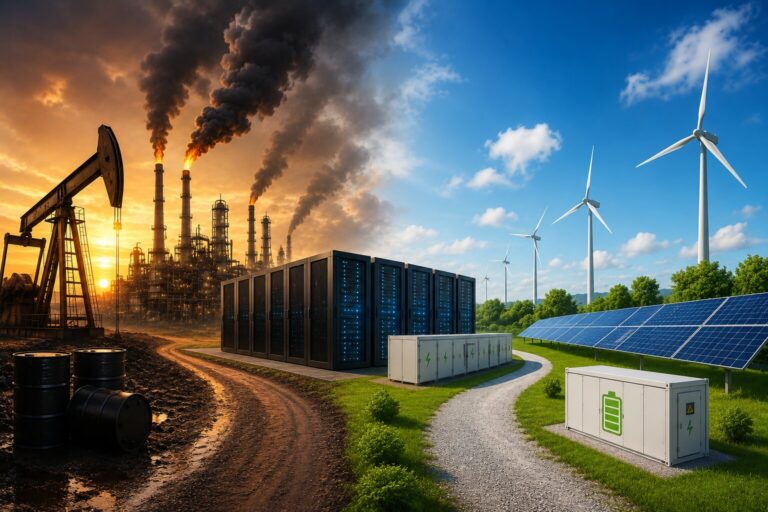
Despite all the emissions, we are experiencing global cooling and not global warming.
FACT
The 10 warmest years in the 143-year record have all occurred since 2010. The global temperature is rising.
Claim post: https://mobile.twitter.com/JunkScience/status/1613724250011242497

WHAT DOES THE POST SAY
A Twitter post by the handle @JunkScience states “NOAA makes it official. Last 8 years… global cooling… at a rate of 0.11°C/decade…. despite 450+ billion tons of emissions worth 14% of total manmade CO2 in the atmosphere. CO2 warming is a hoax.”
This post which claims that the rising earth’s temperature is a hoax has gained a lot of interactions and has 13.4 million views, more than 8 thousand retweets, and more than 700 quote tweets.
WHAT WE FOUND
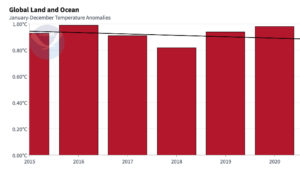
This post is misleading. The post has an image showing the tail end of a much larger bar graph and is misinterpreting what the larger and actual graph showed.
The actual graph was released by NOAA ( National Oceanic and Atmospheric Administration). They have included just the last eight years of the bar graph that, in its entirety, showed how global temperatures compared to the 20th-century average for the last 47 years.
NOAA in its full report included another graph showing the same data, but here the records began even further from 1880 to 2022. That graph shows a change which is unavoidable to be considered.

The report has clearly mentioned certain points:
The table presented in the report has shown the global combined land and ocean annually averaged temperature rank and anomaly for each of the 10 warmest years on record.
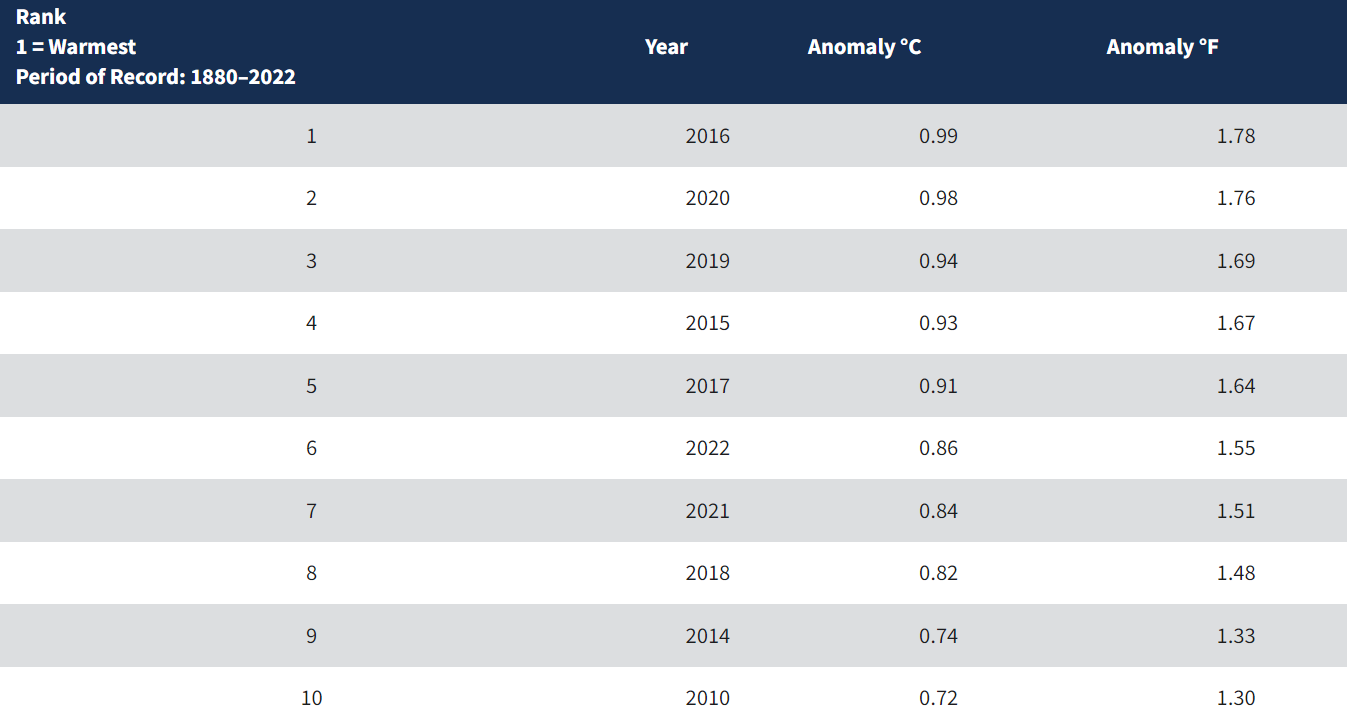
2016 is the warmest ever recorded year.
Also even if we consider the temperature scenarios of the last decade, the NOAA report clearly mentions that “Despite the last two years (2021 and 2022) not ranking among the five warmest years on record, the global annual temperature increased at an average rate of 0.08°C (0.14°F) per decade since 1880 and over twice that rate (0.18°C / 0.32°F) since 1981.”
John Bateman, Meteorologist, at NOAA, told CFC India that the selected timeframe from 2016-2022 can create the appearance of a cooling trend because of the 3 La Niñas which help slightly cool global temperatures but that does not reflect the overall trend. He also explained in detail about the changing trends of El Nino and La Nina highlighted in the report.
Effect of El Ninos and La Ninas on global temperature
“Although the climate is changing to a warmer climate, it is also subject to natural variabilities such as El Niños (unusually warm temperatures across the central and eastern tropical Pacific Ocean) and La Niñas (unusually cool temperatures across the central and eastern tropical Pacific Ocean). El Niños and La Niñas not only affect global weather patterns, but they can also affect global temperatures. During El Niños, global temperatures tend to be warmer than years where ENSO neutral or La Niñas were present, while global temperatures tend to be slightly cooler (however, still above average) during La Niñas,” Bateman said.
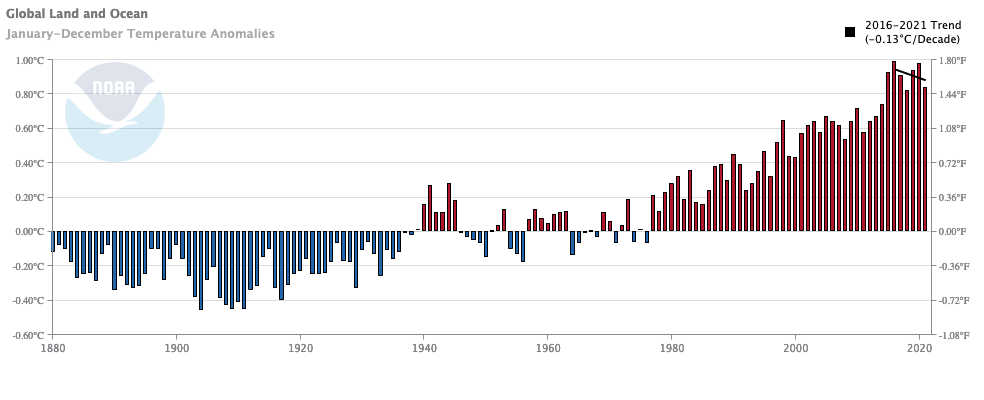
“The year 2016 started off with a strong El Niño, which helped boost global temperatures to new record highs. And since then we’ve had ~ 3 La Niñas which help slightly cool global temperatures. The selected timeframe from 2016-2022 can create the appearance of a cooling trend,” he further said.
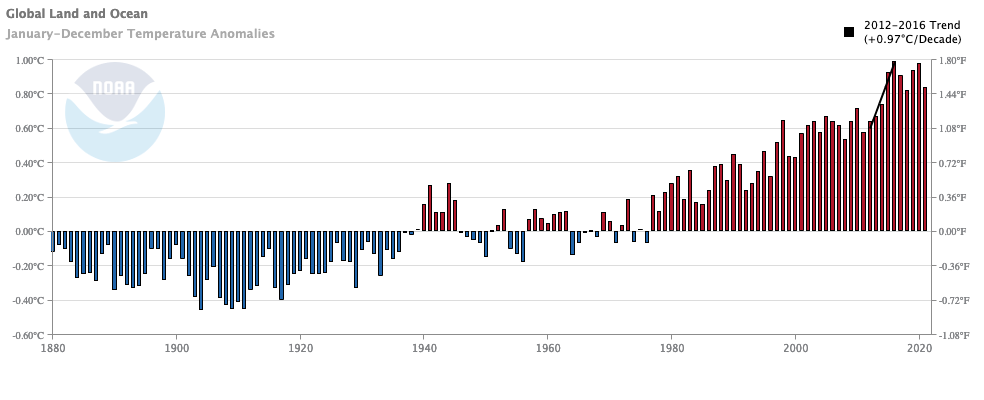
“Similarly, if we select the time period of 2012-2016, you get a warming trend of 0.97 deg C per decade! This is why when computing trends we use timescales of at least 10 years”, said Bateman.
Thus, the global annual temperature increase shows that temperature is increasing and global warming is NOT a hoax. Moreover, presenting just eight years of climate data out of a whole lot is a deceptive act.
(By Aayushi Sharma)

Comments are closed.


Hello climatefactchecks.org webmaster, Thanks for the well-researched and well-written post!
To the climatefactchecks.org administrator, You always provide useful information.
To the climatefactchecks.org admin, Your posts are always a great source of information.