Physical Address
23,24,25 & 26, 2nd Floor, Software Technology Park India, Opp: Garware Stadium,MIDC, Chikalthana, Aurangabad, Maharashtra – 431001 India
Physical Address
23,24,25 & 26, 2nd Floor, Software Technology Park India, Opp: Garware Stadium,MIDC, Chikalthana, Aurangabad, Maharashtra – 431001 India
By Aayushi Sharma
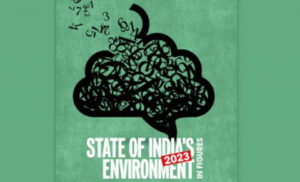
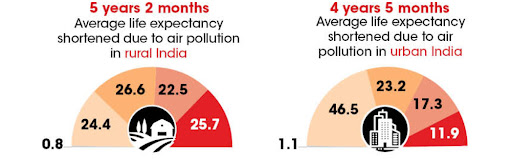
Recently, The State of India’s Environment 2023: In Figures was published by the Centre for Science and Environment (CSE) with Down to Earth. The performance of India’s states has been examined and graded in this study based on four important criteria. Using information that would otherwise remain cold statistics, the report focuses on parameters like, state of climate and extreme weather, agriculture, energy, health, food and nutrition, migration and displacement, waste, water and biodiversity.
Key findings of the reports in different areas
The indicators and their weightages
| INDICATOR | WEIGHTAGE |
| Change in forest cover in 2021 from 2019 | 3 |
| Share of total municipal solid waste that gets treated (2020-21) | 1.5 |
| Share of total sewage that gets treated | 1.5 |
| Change in installed grid renewable power in 2020-21 over 2019-20 | 1 |
| % change in number of polluted river stretches in 2022 over 2018 | 1 |
| Stage of ground water extraction | 1 |
| % of water bodies not in use in 2022 | 1 |
Here is the ranking of the states according to the report:
Telangana was given a score of 7.23 as having the best overall environmental performance in the report due to its advancements in growing its forest cover and in the management of municipal trash. However, the state performed lower than average in parameters including “change in number of polluted river stretches,” “stage of groundwater extraction,” and “share of water bodies not in use.”
Telangana is followed by Gujarat, Goa, and Maharashtra whereas, Rajasthan, Nagaland, and Bihar are on the lowest rank. Six northeastern states, including Assam, are among the bottom 10 states, as well.
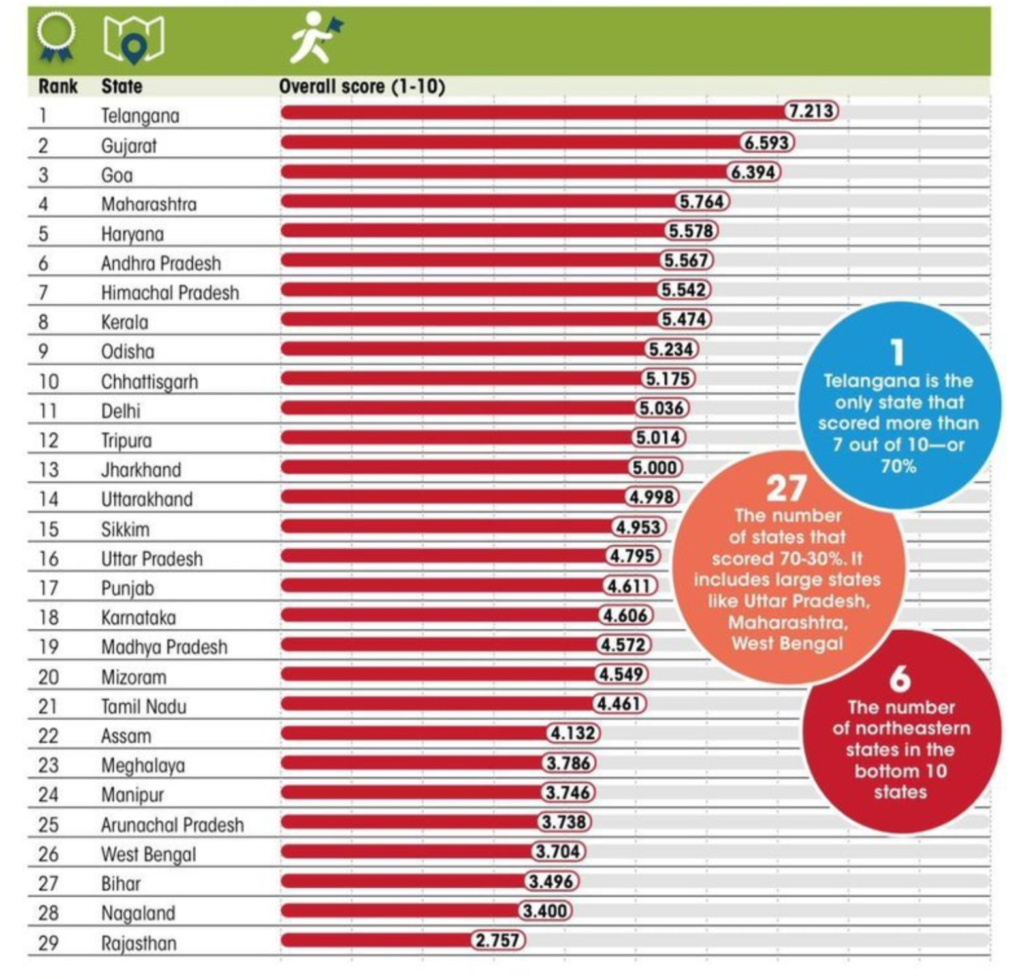
The image shows ranking of the states as per their environmental performance score
Other key highlights of the report are:
India’s ranking was derived, according to the research team at Down to Earth, from the SDG Index and Dashboards Report 2022 published by Bertelsmann Stiftung and the Sustainable Development Solutions Network for the years 2017–2022. The Niti Aayog’s SDG India Index Report 2020-21 is the basis for the state-level rating; the team assessed the 2020 and 2019 scores for this report.
References: