Physical Address
23,24,25 & 26, 2nd Floor, Software Technology Park India, Opp: Garware Stadium,MIDC, Chikalthana, Aurangabad, Maharashtra – 431001 India
Physical Address
23,24,25 & 26, 2nd Floor, Software Technology Park India, Opp: Garware Stadium,MIDC, Chikalthana, Aurangabad, Maharashtra – 431001 India

CLAIM
On August 29, 2022, Greenland gained 7 Gt of ice which proves that Greenland ice mass is now growing and not shrinking.
FACT
Greenland is losing ice overall. The 7 Gt gain of ice cited is in fact a gain in surface mass balance and not identical to the total mass balance (the overall gain or loss of ice) which in this case is a loss of around 84Gt of ice from September 2021 to August 2022.
WHAT THEY SAY
A Twitter post by a profile called Electroverse using the ‘#ClimateScam’ hashtag has gone viral with the claim that on August 29, 2022, Greenland gained 7 Gt of ice which proves that Greenland ice mass is now growing and not shrinking. An article by Electroverse has also been shared by the profile as a comment in the viral Twitter post which claims that the trend of loss of ice in Greenland has now reversed, almost completely.
The Twitter Post:
WHAT WE FOUND
Many climate deniers have been claiming recently that Greenland has gained ice in recent years and the trend of loss has now reversed. They even go on to claim that an overall net gain of ice has been observed in Greenland. To make these claims they misuse various scientific findings or often misunderstand the science behind scientific reports, tools and analysis.
A Repeat Offender
To begin with, it is pertinent to mention that the Twitter profile and the website ‘Electroverse’ is a repeat offender in terms of spreading climate misinformation. We had earlier debunked one such claim by Electroverse that wrongly cited a scientific tool by the University of Maine to claim that global warming is not happening and the Earth is actually colder than believed. Another fact check on an Electroverse claim done by USA Today further proves that Electroverse has spread climate misinformation even before.
Polar Portal
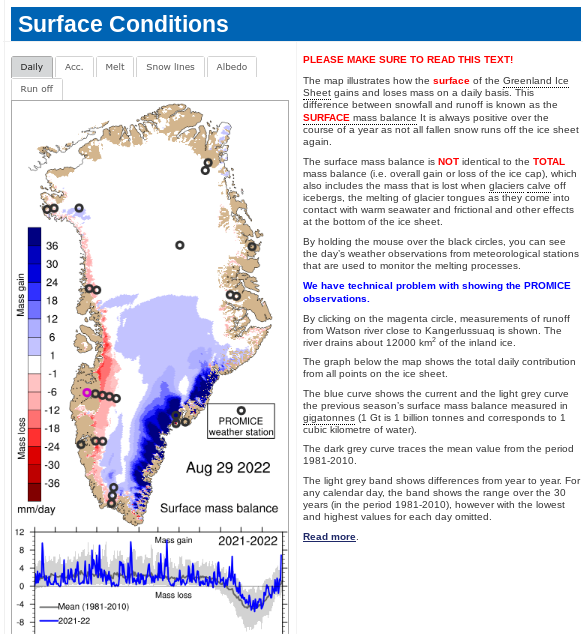
Coming to the viral Twitter post in question, we noticed that it has cited a map that seems to be the end product of some scientific tool. We came across the words ‘surface mass balance’ and the date ‘August 29 2022’ written on the map.
Taking cue from the USA Today fact check, we found out that it has been obtained by using a feature of the Polar Portal, an initiative by Danish research institutions to display the results of their monitoring of the Greenland Ice Sheet and the sea ice in the Arctic.
We went to the ‘Surface Conditions’ section of the Polar Portal website and input the date as ‘August 29, 2022’ which led us to the exactly similar map cited in the viral Twitter post.

We came across the ‘PLEASE MAKE SURE TO READ THIS TEXT!’ section in which it has been clearly mentioned that the particular map is showing Surface Mass Balance (SMB) and must not be confused with Total Mass Balance (TMB) which is the overall gain or loss of ice.
‘The map illustrates how the surface of the Greenland Ice Sheet gains and loses mass on a daily basis. This difference between snowfall and runoff is known as the SURFACE mass balance. It is always positive over the course of a year as not all fallen snow runs off the ice sheet again,’ the section reads.
‘The surface mass balance is NOT identical to the TOTAL mass balance (i.e. overall gain or loss of the ice cap), which also includes the mass that is lost when glaciers calve off icebergs, the melting of glacier tongues as they come into contact with warm seawater and frictional and other effects at the bottom of the ice sheet,” the section further adds.
What does the expert say?
Next, we contacted Dr. Martin Stendel, Senior Climate Scientist at the National Centre for Climate Research, Danish Meteorological Institute who is also the publisher of the Polar Portal. Dr Stendel confirmed to us that the claim ‘Greenland is gaining ice mass’ is wrong and in fact, Greenland has been losing ice every year since 1997 for 26 years in a row and from September 2021 to August 2022, it lost around 84Gt of ice.
The Senior Climate Scientist explained in an email to us:
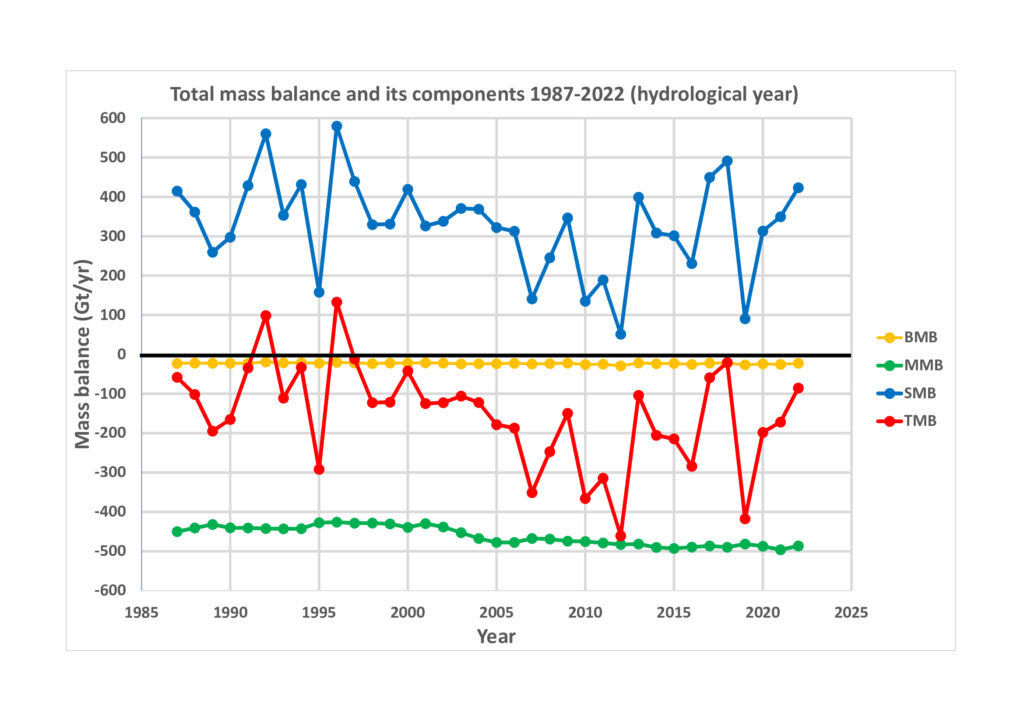
“If we want to evaluate the total mass balance of the Greenland Ice Sheet (TMB), we have to consider what is happening on the ice cap (the surface mass balance SMB), along the edges of the ice cap (the marine mass balance MMB), and under the ice cap (the basal mass balance BMB).
Thus, TMB = SMB + MMB + BMB.
These terms are positive when mass is added to the ice sheet and negative when the ice sheet loses mass. Ideally, TMB should be zero, at least when averaged over a couple of years.
SMB is the difference between mass gain by snowfall and mass loss by runoff into the ocean. It is always positive.
MMB is what is lost from the ice sheet by the calving of icebergs and melting of glacier tongues in contact with (relatively) warm seawater. It is always negative.
BMB is what is lost via friction, ground heat flux and a couple of other factors. It is rather small, but always negative.

Here we see that:
(1) the only possibility for the ice cap to gain ice is via the SMB, i.e. through snowfall. The other components, MMB and BMB, are always negative, so the surplus of snowfall over runoff and the two other components need to be large enough.
(2) the variability in TMB is mainly caused by the variability in SMB, i.e. by weather. In dry and warm years, the SMB is just marginally positive, as in 2012. In comparably cool and wet years, like 2018, the SMB is large.
(3) the ice cap loses mass through iceberg calving and glacier tongue melting, and this loss has slightly increased over time.
(4) the contribution from below the ice cap is small, but not zero.
(5) the TMB has been negative (i.e., the ice cap has lost mass) every year since 1997. That is 26 years in a row.”
How reliable is all that data?
The data is reliable, confirmed Dr Stendel. “By means of the GRACE satellites, we can estimate the total mass balance independently. However, the tiny gravity difference the satellites measure first have to be expressed as mass changes, which is the cause that the GRACE data always is a few months behind,” he said.
MMB, which is the amount of ice being lost by the process of calving and submarine melting, can be estimated. “Using satellites, we can measure the speed at which ice flows through control points on the ice sheet where we know the thickness and shape of the ice. Thus we can estimate MMB. This data is openly available, allowing us to monitor the whole ice sheet budget,” Dr Stendel added.
“From 1 April 2002 to 31 August 2021, the period common to both datasets, the Greenland Ice Sheet has lost approximately 4500 Gt of ice. This is equivalent to 1.3 cm of global average sea level rise, just from the Greenland Ice Sheet. We note that the two methods are completely independent from each other.,” Dr Stendel further added.
Comments are closed.
[…] Also, read this in English […]
[…] read this in English | […]
[…] ஃபேக்ட்செக் கட்டுரையை படிக்க இங்கே கிளிக் செய்யவும்.இந்த தகவல் […]
[…] read this in English | […]